Analysis of Bacterial Microbiomes Using 16S Amplicon Sequencing
Our laboratory uses 16S amplicon sequencing to characterize bacterial populations from human, animal and environmental samples. The following are examples of recent microbiome/microbiota analyses performed in the laboratory.
Water biofilms
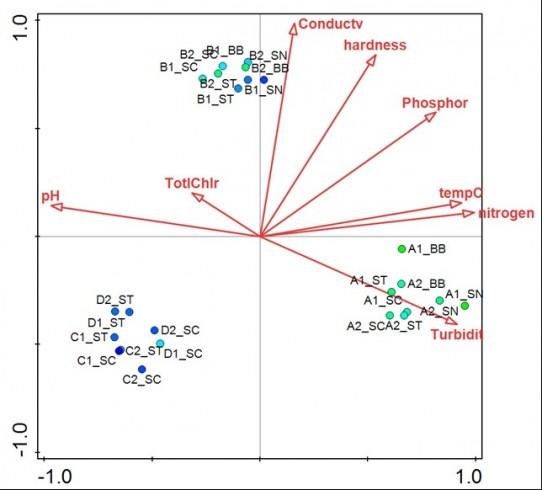
Canonical Correspondence Analysis of water bioreactor biofilms. The biplot shows clustering of biofilm bacterial populations according to bioreactor (letter A, B, C or D in sample code indicates reactor). Biofilm samples are represented by colored circles where the colour of the circle reflects the OTU diversity. Arrows represent water quality parameters and point in the direction of the steepest increase of each parameter. Projection of sample points onto each arrow indicates the relative value of each water quality parameter for a particular sample. Reference: Luo et al., 2015, Impact of Bioreactor Environment and Recovery Method on the Profile of Bacterial Populations from Water Distribution Systems. http://journals.plos.org/plosone/article?id=10.1371/journal.pone.0133427.
Effect of diet on rat intestinal microbiome
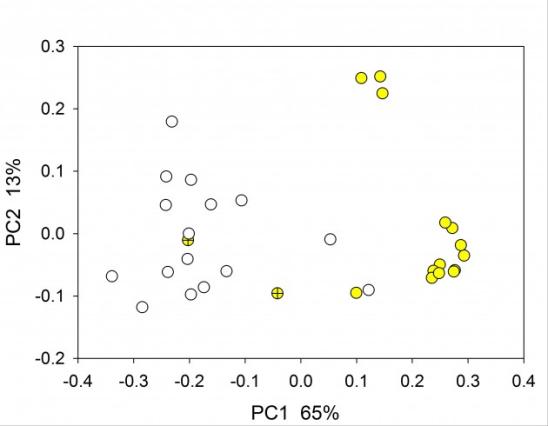
Principal Coordinate Analysis of rat fecal microbiome based on 16S amplicon sequencing of the V1V2 variable region. Yellow symbols indicate experimental group fed a high-fat diet; empty symbols, control animals fed a normal diet; yellow, high-far diet. Crossed symbol indicates fecal sample collected on day 1 of diet (Mann P, Bridges R and Widmer G, unpublished).
Response of human bacterial microbiome to antibiotic
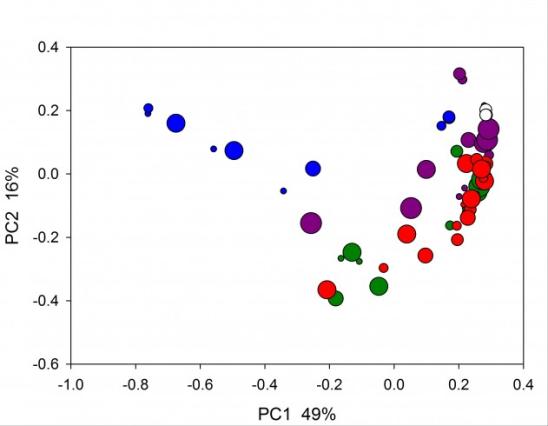
Principal Coordinate Analysis of bacterial microbiome in humanized piglets subjected to different antibiotic treatments. Neonatal germ-free piglets were orally inoculated with a fecal pool from healthy human donors (http://www.ncbi.nlm.nih.gov/pmc/articles/PMC3669164/). Groups of 2-3 pigs were treated with different antibiotics represented by colors (green, untreated controls; white, triplicate analysis of human inoculum). Symbol size indicates day post-transplant of human microbiome into gnotobiotic neonatal pigs, where the smallest symbols indicates day 6 and the largest day 17 post-inoculation (Widmer and Tzipori, unpublished).